Become math lovers!
What is a bar graph ?
A bar graph is a kind of graph that we use to compare quantities. Rectangular bars are used to compare these quantities and we can arrange these bars either vertically or horizontally.
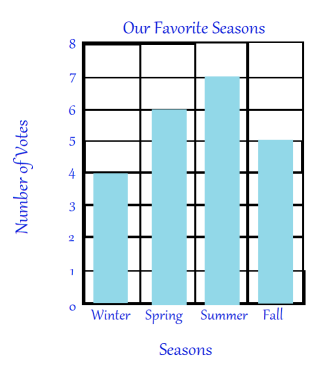
The vertical bar graph below shows people's favorite seasons of the year.

1. What is the least favorite season according to the bar graph?
The least favorite season is Winter.
2. What is the most favorite season according to the bar graph?
The most favorite season is summer.
3. About how many people like summer more than winter?
Seven people said they preferred summer and four people said they preferred summer. Therefore, three more people preferred summer than winter.
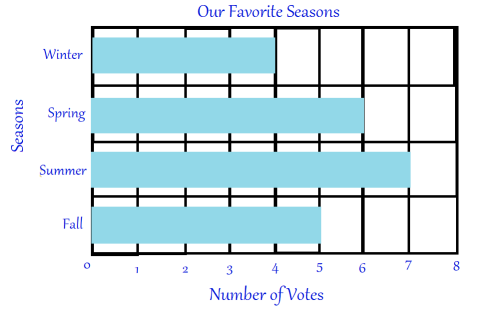
We can also arrange the information with a horizontal bar graph.
